Filebeat, Metricbeat & Hearbeat
Knowing what is happening in Docker and in your applications running on Docker is critical. To collect logs from my Swarm and monitor the health of it, I use the ELK-B stack which is made up of four pieces of software called ElasticSearch, LogStash (I recommend that you use Beats instead of LogStash), Kibana and various Beats.
ElasticSearch is basically a No-SQL database that is geared towards storing JSON documents and searching across them. Kibana is a visualization took that gives you a nice UI to view all of your data and produce nice visualizations and dashboards. There are several Beats which are used to ship data into ElasticSearch from various sources.
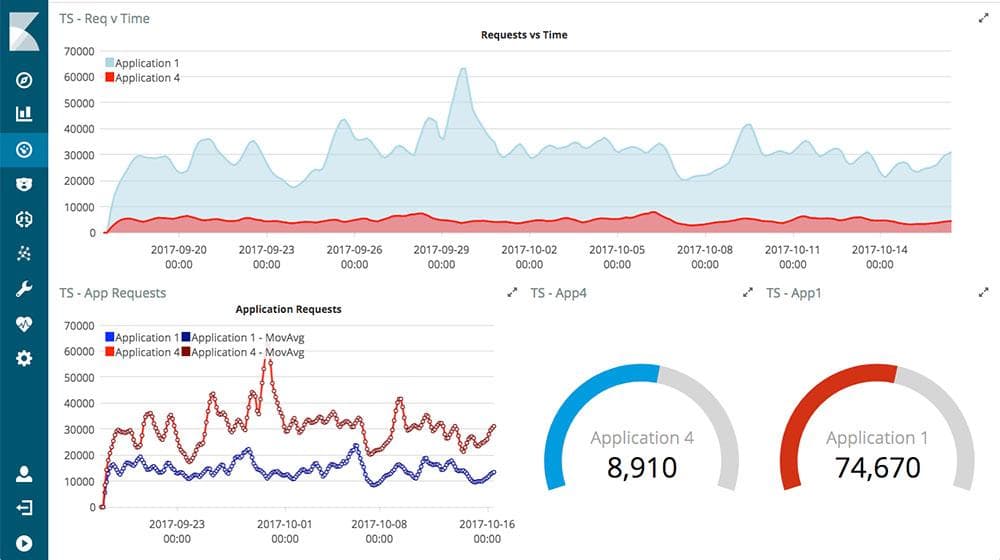
While you could use Docker to host ElasticSearch and Kibana, I use the ElasticCloud at work, you could also use instances hosted by AWS and Azure. Using a hosted version takes some of the pain out of maintaining ElasticSearch. I had a look at the ElasticSearch Docker container and if you really want to go down the Docker route and create an ElasticSearch cluster, it looks fairly straightforward but a bit unorthodox. There is a cost versus effort trade-off in this decision and it's up to you where you decide to go.
In terms of Beats, I use three of them which I'll talk about below:
Filebeat
Filebeat is a tool used to ship Docker log files to ElasticSearch. The latest version 6.0 queries Docker APIs and enriches these logs with the container name, image, labels, and so on which is a great feature, because you can then filter and search your logs by these properties. You can then view these logs in a fully customizable Kibana dashboard. Filebeat ships with a sample Kibana dashboard that looks like this:
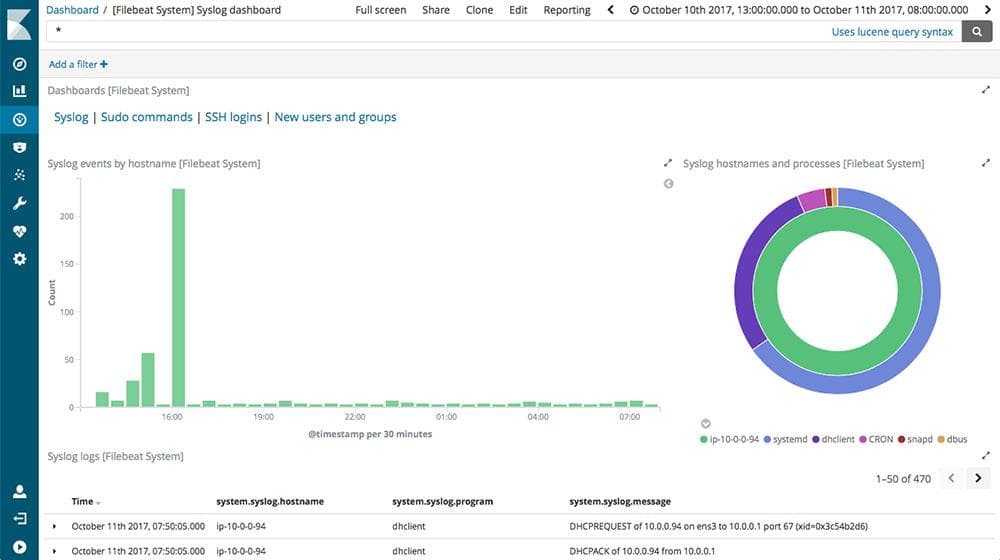
As well as shipping Docker logs, I write the logs from my ASP.NET Core applications to disk (The best way to make sure you never lose log information) and then use Filebeat to ship these log files to ElasticSearch.
The Dockerfile below is used to add Filebeat configuration files to the base Filebeat image and nothing more. The configuration files are pretty lengthy and heavily commented so I've omitted them:
FROM docker.elastic.co/beats/filebeat:6.0.0
COPY filebeat.yml filebeat.template.json /usr/share/filebeat/
USER root
RUN chown filebeat /usr/share/filebeat/filebeat.yml && /
    chown filebeat /usr/share/filebeat/filebeat.template.json && /
    chmod go-w /usr/share/filebeat/filebeat.yml && /
    chmod go-w /usr/share/filebeat/filebeat.template.json
USER filebeat
In the Docker stack file below, I setup a shared volume called 'logs' in which my website container stores all of it's log files. My custom Filebeat image then picks up logs from the 'logs' volume and pushes them to ElasticSearch. Filebeat is also configured so that one instance of the container runs on every Docker node, so that it can pick up Docker logs from every node in my Swarm.
version: '3.3'

  filebeat:
    image: my-custom-filebeat-image:latest
    deploy:
      mode: global # One docker container per node
    networks:
      - defaultoverlay
    volumes:
      - logs:/var/log/my-company-name

  website-name:
    image: website-name:latest
    ports:
      - "5000:80"
    networks:
      - defaultoverlay
    volumes:
      - logs:/var/log/my-company-name

networks:
  defaultoverlay:

volumes:
  logs:
Metricbeat
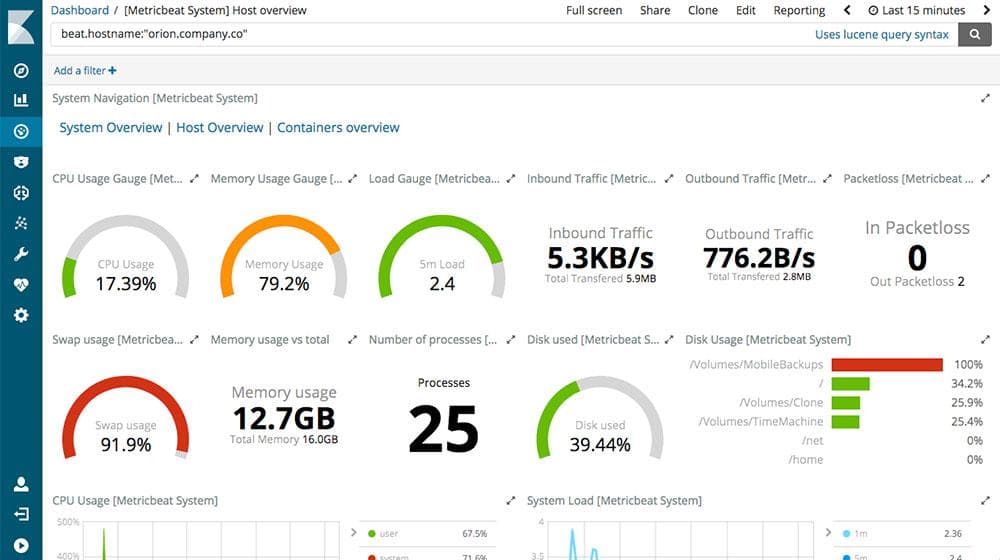
Metricbeat can be used to monitor the CPU, memory and disk usage on your Docker nodes and then ship those logs to your ElasticSearch cluster. Once again Metricbeat ships with a sample Kibana dashboard that looks like this:
Here is an example of a custom Metricbeat Dockerfile which I use to configure Metricbeat:
FROM docker.elastic.co/beats/metricbeat:6.0.0
COPY metricbeat.yml metricbeat.template.json /usr/share/metricbeat/
USER root
RUN chown metricbeat /usr/share/metricbeat/metricbeat.yml && /
    chown metricbeat /usr/share/metricbeat/metricbeat.template.json && /
    chmod go-w /usr/share/metricbeat/metricbeat.yml && /
    chmod go-w /usr/share/metricbeat/metricbeat.template.json
USER metricbeat
And here is the Docker stack file below. Once again it configures one instance of Metricbeat to run on each Docker node. It also needs access to the Docker socket and a bunch of other folders on the Docker node, so that explains all of the volume mounts.
version: '3.3'

services:
  metricbeat:
    image: my-custom-metricbeat-image:latest
    command: metricbeat -e -system.hostfs=/hostfs
    deploy:
      mode: global # One docker container per node
    networks:
      - defaultoverlay
    volumes:
      - /proc:/hostfs/proc:ro
      - /sys/fs/cgroup:/hostfs/sys/fs/cgroup:ro
      - /:/hostfs:ro
      - /var/run/docker.sock:/var/run/docker.sock

networks:
  defaultoverlay:
Heartbeat
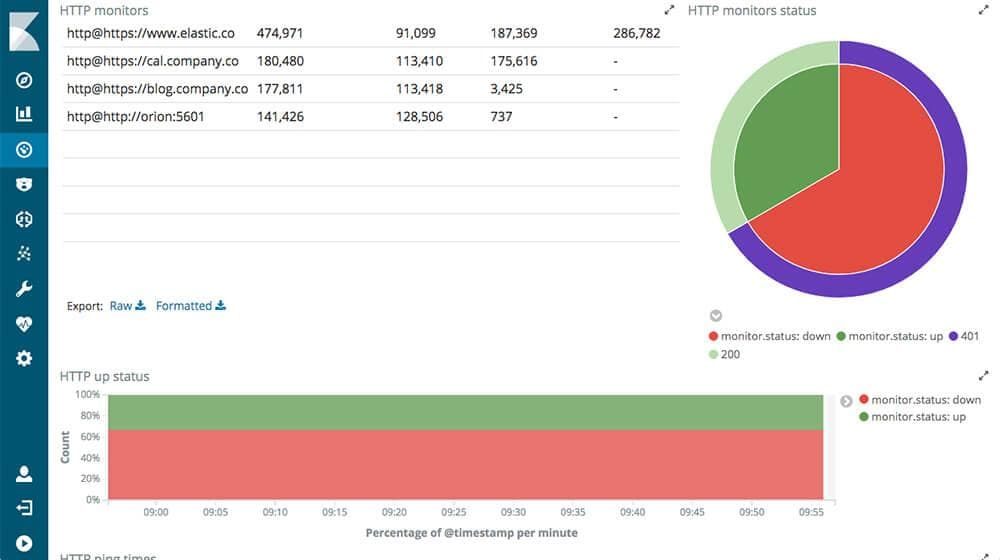
Heartbeat is a ping monitor that can be pointed at any status endpoints in your API's or websites. Failures get logged in ElasticSearch which show up in a nice graph. You can also use Kibana to set up alerts, so you can be notified of any downtime. Here is an example of what a Kibana Dashboard containing Heartbeat data looks like:
The Dockerfile is similar to the other Beats:
FROM docker.elastic.co/beats/heartbeat:6.0.0
COPY heartbeat.yml heartbeat.template.json /usr/share/heartbeat/
USER root
RUN chown heartbeat /usr/share/heartbeat/heartbeat.yml && /
    chown heartbeat /usr/share/heartbeat/heartbeat.template.json && /
    chmod go-w /usr/share/heartbeat/heartbeat.yml && /
    chmod go-w /usr/share/heartbeat/heartbeat.template.json
USER heartbeat
This Docker stack file is extremely simple. There is only one instance of the image required.
version: '3.3'

services:
  heartbeat:
    image: my-custom-heartbeat-image:latest
    networks:
      - defaultoverlay

networks:
  defaultoverlay:
Ping monitors on the internet are super expensive for what they are, this is because they send pings from various locations on the Earth. Heartbeat will not do that, so be aware of this difference. That said, there is nothing I can do if the pipe for the internet in Australia goes down, so in my opinion, Heartbeat reduces a lot of false positives.
Conclusions
I have discovered that I have enough material for a third and final part to this series of blog posts. In the next part, you can expect to learn more about Redis and Metabase Docker images.
Comment
Initializing...