
- Open Telemetry - Deep Dive into Open Telemetry for .NET
- Open Telemetry - Configuring Open Telemetry for ASP.NET Core
- Open Telemetry - Exporting Open Telemetry Data to Jaeger
- Open Telemetry - Optimally Configuring Open Telemetry Tracing for ASP.NET Core
As I talked about in my first post, the end goal is to get nice visualisations from our Open Telemetry data, so we can spot patterns and learn something from the behaviours of our applications.
In this post, I'll show how we can export the Open Telemetry traces, logs and metrics that we've collected to Jaeger and view them in the Jaeger dashboard.
Open Telemetry Protocol (OTLP)
There are actually two methods of exporting our telemetry to Jaeger. The first uses Jaeger's proprietary protocol and is not something I plan to cover in this post. The second uses the Open Telemetry Protocol (OTLP), which is an open standard that we can use to export Open Telemetry data to any application that supports it.
Jaeger is a pretty complex application that splits it's responsibilities into several separate binaries. It splits the collection of telemetry into a binary called a 'collector'. If we want Jaeger to collect telemetry using the Open Telemetry Protocol, we need to use the Jaeger Open Telemetry collector. I'm not going to cover how we can setup Jaeger in a full production setup. Instead I'll be using the jaegertracing/opentelemetry-all-in-one Docker image which makes running Jaeger with the Open Telemetry collector as easy as running this command:
docker run --name jaeger -p 13133:13133 -p 16686:16686 -p 4317:55680 -d --restart=unless-stopped jaegertracing/opentelemetry-all-in-oneI've also opened up a few ports to the Docker container:
- 4317 - Open Telemetry Protocol (OTLP) receiver where we expect to receive Open Telemetry data.
- 16686 - Dashboard where users can see visualisations.
- 13133 - Jaeger health check.
Warning
The default port used by the Open Telemetry Protocol has recently been changed from 55680 to 4317. This change has not yet been made in Jaeger which uses the older port number.
Exporting from .NET
In the last post I showed how we can collect Open Telemetry data in an ASP.NET Core application. I'm going to build on that example to export to Jaeger. To start with, we'll need to add an additional NuGet package called OpenTelemetry.Exporter.OpenTelemetryProtocol:
<PackageReference Include="OpenTelemetry.Exporter.Console" Version="1.0.1" />
<PackageReference Include="OpenTelemetry.Exporter.OpenTelemetryProtocol" Version="1.0.1" />
<PackageReference Include="OpenTelemetry.Extensions.Hosting" Version="1.0.0-rc2" />
<PackageReference Include="OpenTelemetry.Instrumentation.AspNetCore" Version="1.0.0-rc2" />
Then we can use the AddOtlpExporter method to configure where to export to. In this case, I'm exporting to http://localhost:4317 where port 4317 is the default port used by the Open Telemetry Protocol. Ideally, we'd retrieve this value from configuration but I'm keeping things simple in this example.
services.AddOpenTelemetryTracing(
    builder =>
    {
        builder
            .SetResourceBuilder(ResourceBuilder
                .CreateDefault()
                .AddService(webHostEnvironment.ApplicationName))
            .AddAspNetCoreInstrumentation()
            .AddOtlpExporter(options => options.Endpoint = new Uri("http://localhost:4317"));
        if (webHostEnvironment.IsDevelopment())
        {
            builder.AddConsoleExporter(options => options.Targets = ConsoleExporterOutputTargets.Debug);
        }
    });
The Dashboard
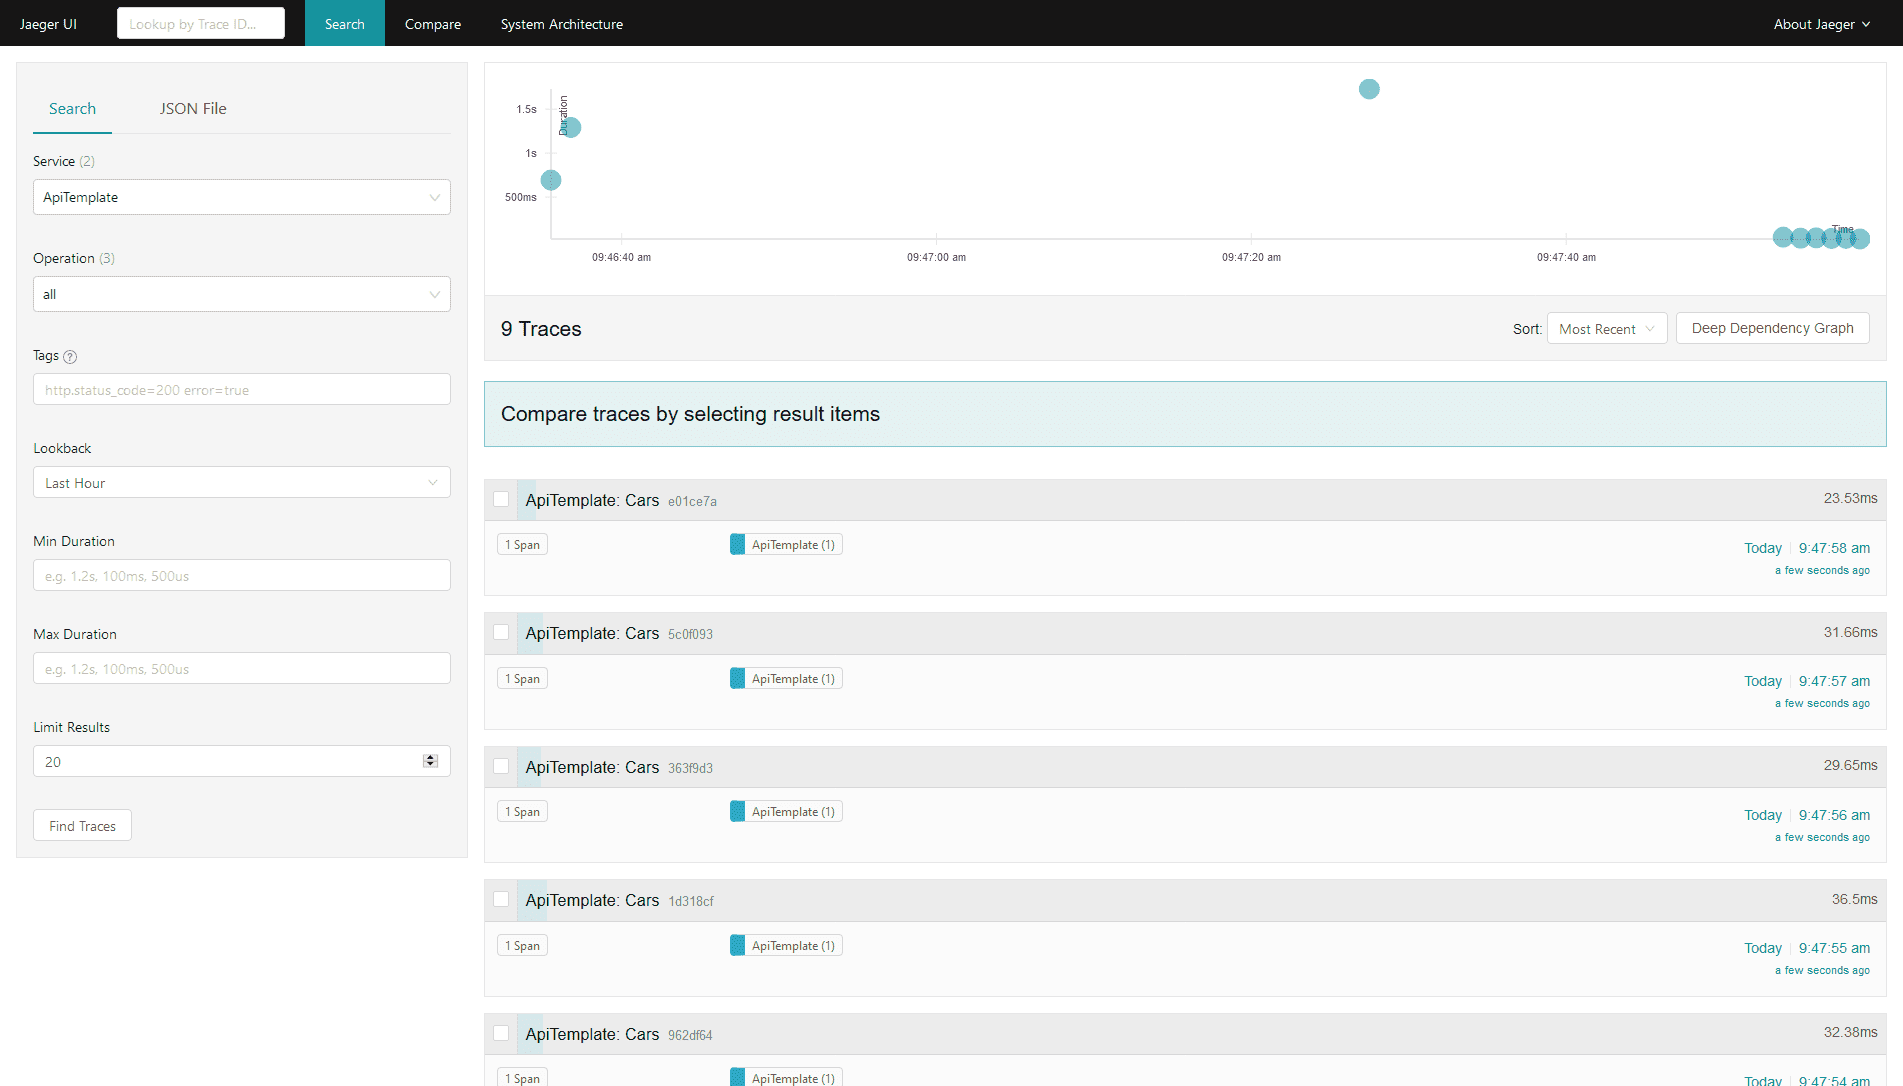
We can now fire up the Jaeger dashboard in our browser which we can access at http://localhost:16686. If we execute some request/response cycles in our application where we have added Open Telemetry support, we can see the telemetry for each request/response:
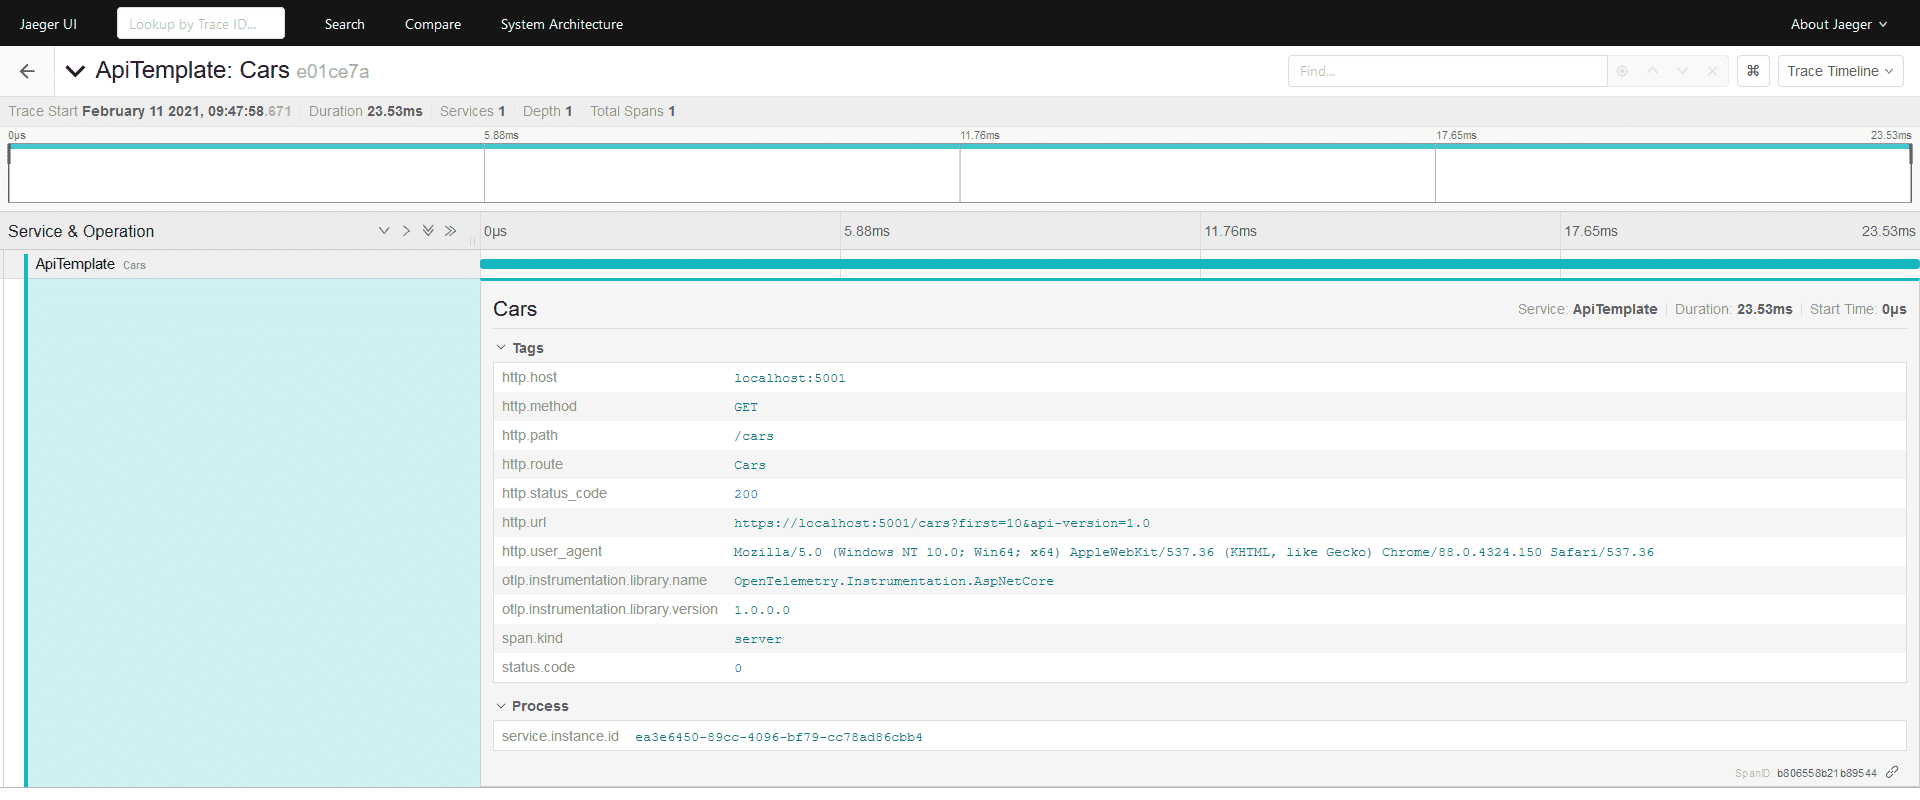
If we drill down into a particular request/response trace, we can view the spans (in this simple example, there is only one) and all attributes associated with the span. This is the same data we saw in the debug output from my previous post:
Up Next
In this post, I've shown how you can quickly fire up Jaeger and how you can get an ASP.NET Core app to export Open Telemetry data to it. In my next final post I'll discuss optimally configuring Open Telemetry for an ASP.NET application.
Comment
Initializing...