- Open Telemetry - Deep Dive into Open Telemetry for .NET
- Open Telemetry - Configuring Open Telemetry for ASP.NET Core
- Open Telemetry - Exporting Open Telemetry Data to Jaeger
- Open Telemetry - Optimally Configuring Open Telemetry Tracing for ASP.NET Core
Open Telemetry is an open source specification, tools and SDK's used to instrument, generate, collect, and export telemetry data (metrics, logs, and traces). Open Telemetry is backed by the Cloud Native Computing Foundation (CNCF) which backs a mind boggling array of popular open source projects. It's worth looking at the CNCF Landscape to see what I really mean. The SDK's support all the major programming languages including C# and ASP.NET Core.
In this post, I'm going to discuss what Open Telemetry is all about, why you'd want to use it and how to use it with .NET specifically. With a typical application there are three sets of data that you usually want to record: metrics, logs and traces. Lets start by discussing what they are.
Logging
Provides insight into application-specific messages emitted by processes. In a .NET application, Open Telemetry support can easily be added if you use ILogger for logging which lives in the Microsoft.Extensions.Logging NuGet package. You'd typically already use this if you're building an ASP.NET Core application.
Metrics
Provide quantitative information about processes running inside the system, including counters, gauges, and histograms. Support for metrics in Open Telemetry is still under development and being finalised at the time of writing. Examples of metrics are:
- Percentage CPU usage.
- Bytes of memory used.
- Number of HTTP requests.
Tracing
Also known as distributed tracing, this records the start and end times for individual operations alongside any ancillary data relevant to the operation. An example of this is recording a trace of a HTTP request in ASP.NET Core. You might record the start and end time of a request/response and the ancillary data would be the HTTP method, scheme, URL etc.
If an ASP.NET Core application makes database calls and HTTP requests to external API's these could also be recorded if the database and API's which are in totally separate processes also support recording Open Telemetry tracing. It's possible to follow the trace of a HTTP request from a client, down to your API, down to a database and all the way back again. This allows you to get a deep understanding of where the time is being spent or if there is an exception, where it is occurring.
Jaeger
Collecting metrics, logs and traces is only half of the equation, the other half is exporting that data to various applications that know how to collect Open Telemetry formatted data, so you can view it. The endgame is to be able to see your data in an easily consumable fashion using nice visualisations, so you can spot patterns and solve problems.
The two main applications that can collect and display Open Telemetry compatible trace data are Jaeger and Zipkin. Zipkin is a bit older and doesn't have as nice a UI, so I'd personally recommend Jaeger. It looks something like this:
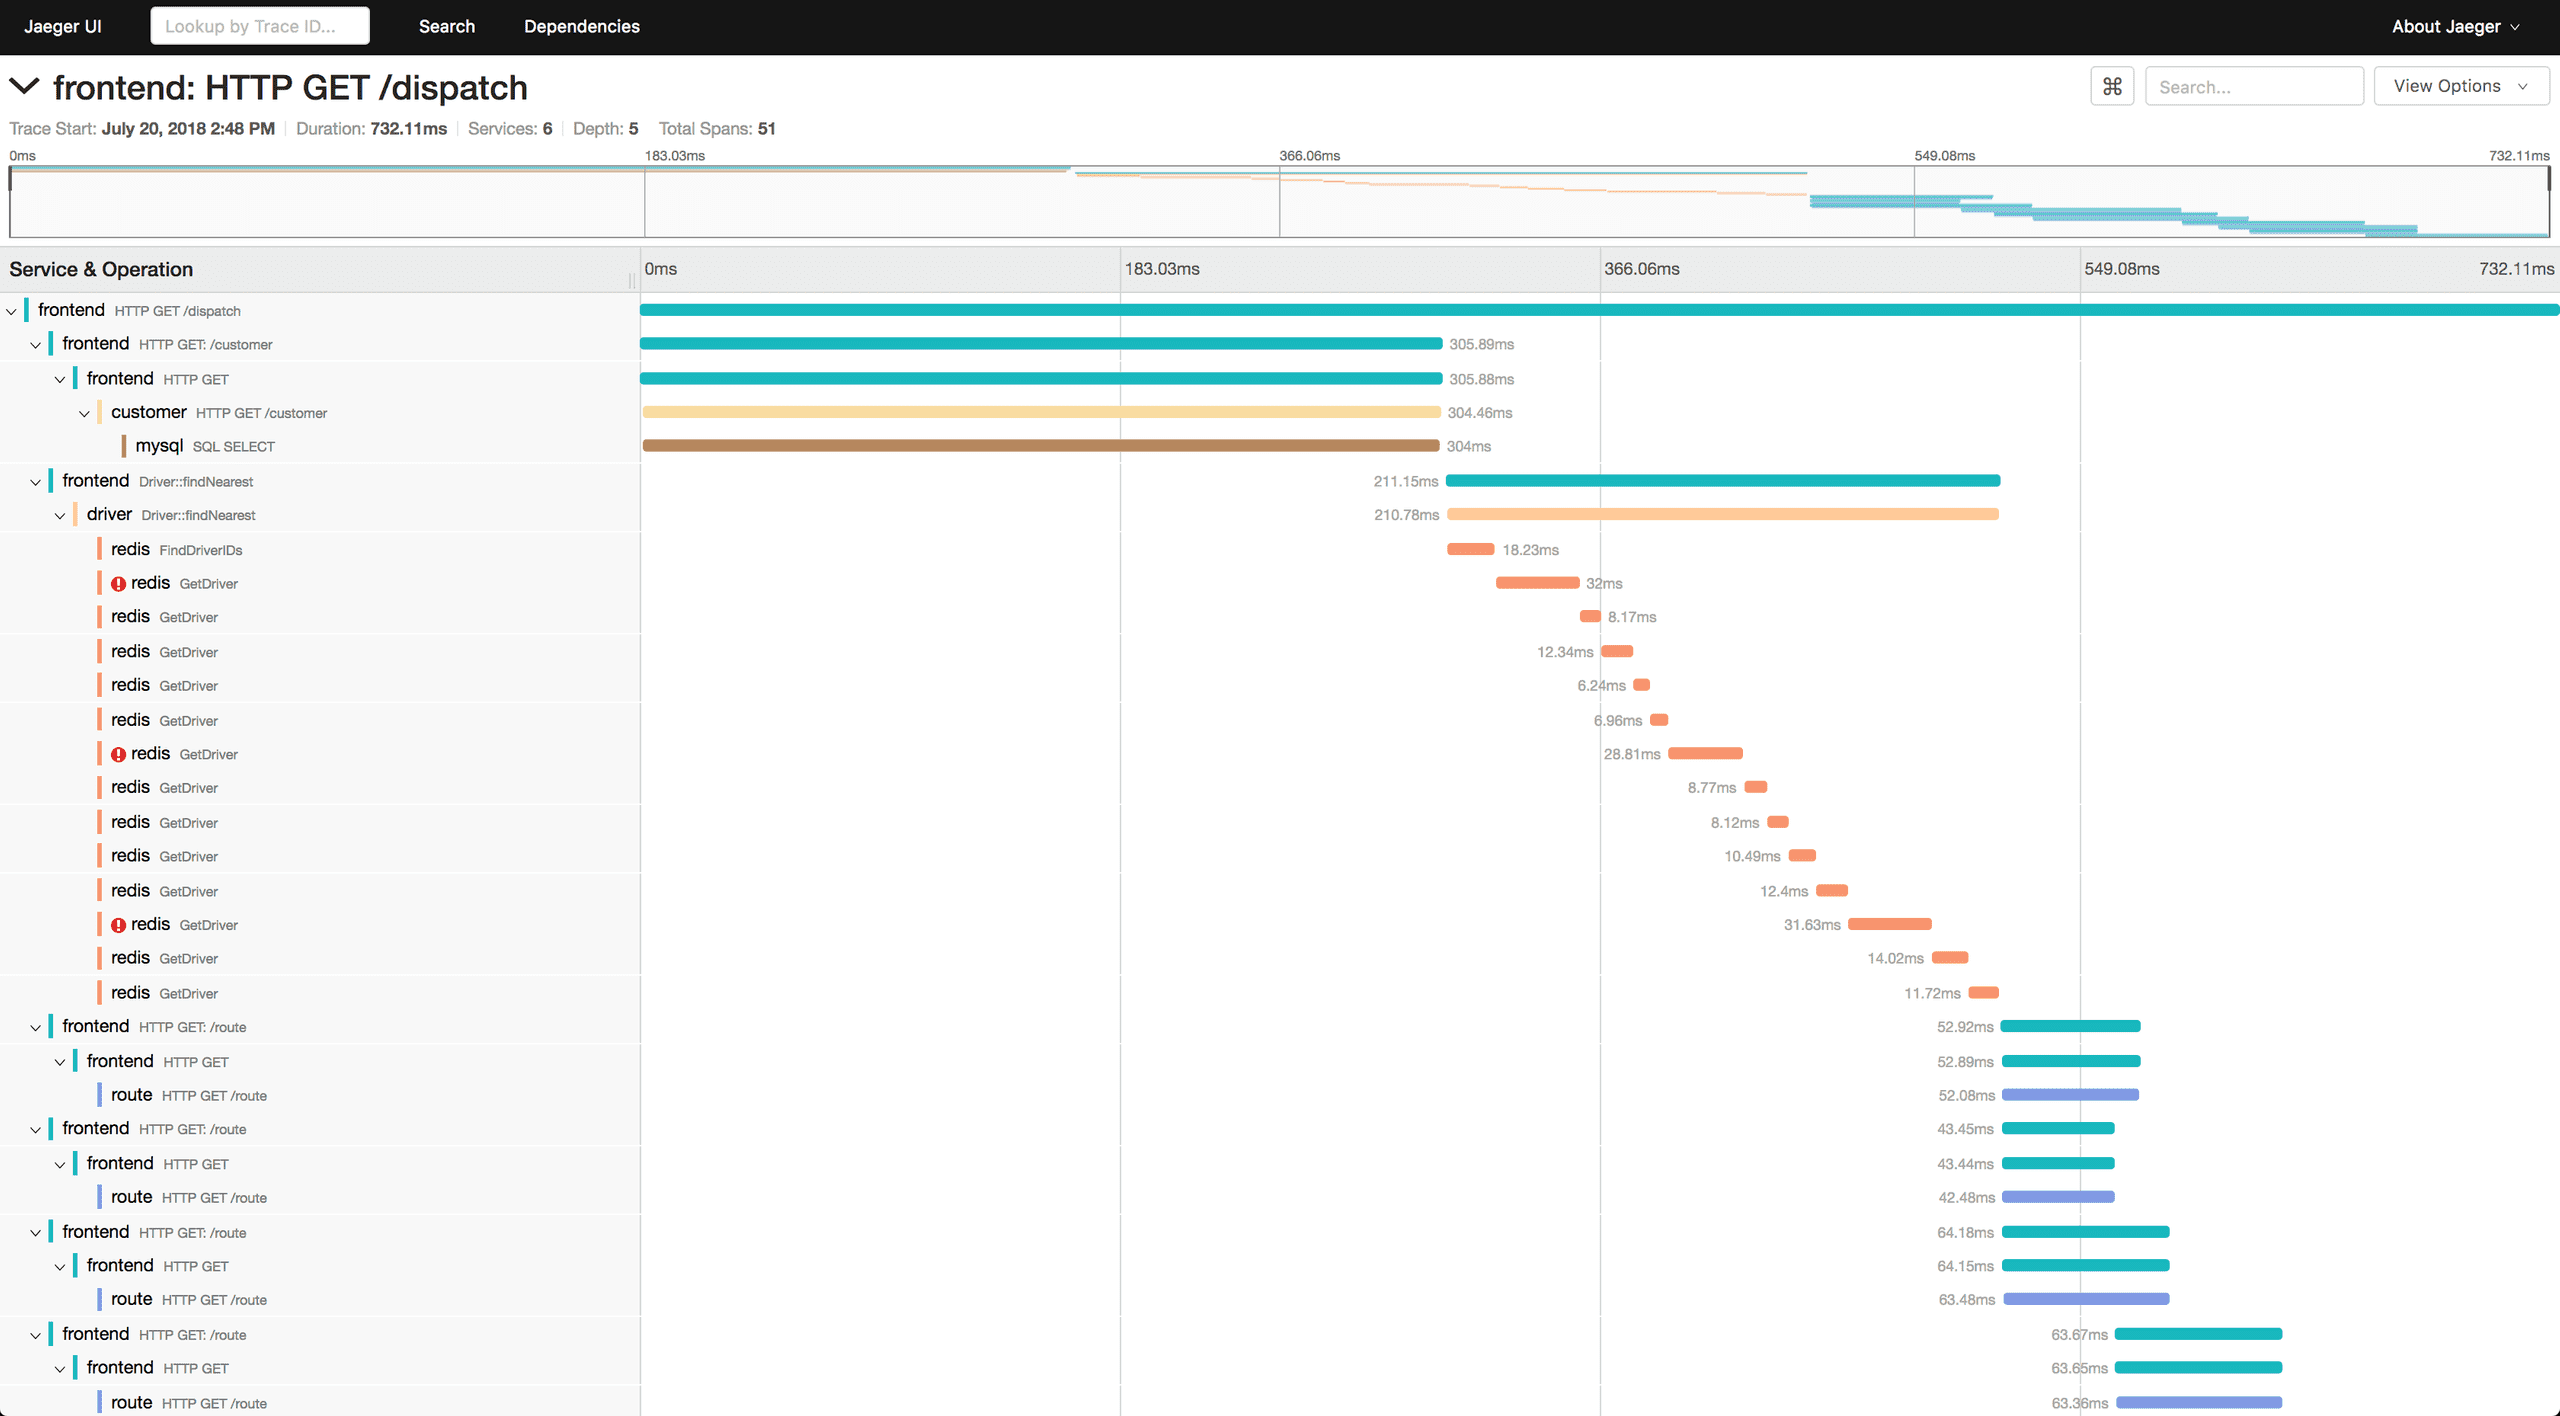
The above image shows the trace from a 'frontend' application. You can see how it makes calls to MySQL, Redis and external API's using HTTP requests. The length of each line shows how long it took to execute. You can easily see all of the major operations executed in a trace from end to end. You can also drill into each individual line and see extra information relevant to that part of the trace. I'll show you how you can run Jaeger and collect Open Telemetry data in my next blog post.
Spans
Each line in the Jaeger screenshot above is called a Span or in .NET is represented by the System.Activities.Activity type. It has a unique identifier, start and end time along with a parent span unique identifier too, so it can be connected to other spans in a tree structure representing an overall trace. Finally, a span can also contain other ancillary data that I will discuss further on.
Tip
Unfortunately, .NET's naming has significantly deviated from the official Open Telemetry specification, resulting in quite a lot of confusion on my part. Happily, I've been through that confusion, so you don't have to!
My understanding is that .NET already contained a type called Activity, so the .NET team decided to reuse it instead of creating a new Span type like you'd expect. This means that a lot of naming does not match up with the Open Telemetry specification. From this point forward you can use the words 'span' and 'activity' interchangeably.
Recording your own traces using spans is pretty simple. First we must create an ActivitySource from which spans or activities can be recorded. This just contains a little information about the source of the spans created from it.
private static ActivitySource activitySource = new ActivitySource(
    "companyname.product.library",
    "semver1.0.0");
Then we can call StartActivity to start recording and finally call Dispose to stop recording the span.
using (var activity = activitySource.StartActivity("ActivityName")
{
    // Pretend to do some work.
    await LongRunningAsync().ConfigureAwait(false);
} // Activity gets stopped automatically at end of this block during dispose.
Events
Along with our span we can record events. These are timestamped events that occur at a single point in time within your span.
using (var activity = activitySource.StartActivity("ActivityName")
{
    await LongRunningOperation().ConfigureAwait(false);
}

public async Task LongRunningOperationAsync()
{
    await Task.Delay(1000).ConfigureAwait(false);

    // Log timestamped events that can take place during an activity.
    Activity.Current?.AddEvent(new ActivityEvent("Something happened."));
}
Within the LongRunningOperationAsync method, we don't have access to the current span. One way to get hold of it would be to pass it in as a method parameter. However, a better way that decouples the two operations is to use Activity.Current which gives you access to the current span within the currently running thread.
One common pitfall I can foresee is that Activity.Current could be null due to the caller deciding not to create a span for some reason. Therefore, we use the null conditional operator ?. to only call AddEvent if the current span is not null.
Attributes
Attributes are name value pairs of data that you can record as part of an individual span. The attribute names have a loose standard for how they are put together that I'll talk about further on.
Tip
Tags in .NET are called Attributes in the Open Telemetry specification.
using (var activity = activitySource.StartActivity("ActivityName")
{
    await LongRunningOperation().ConfigureAwait(false);
}

public async Task LongRunningOperationAsync()
{
    await Task.Delay(1000).ConfigureAwait(false);

    // Log an attribute containing arbitrary data.
    Activity.Current?.SetTag("http.method", "GET");
}
You can add new attributes or update existing attributes using the Activity.SetTag method. There is also an Activity.AddTag method but that will throw if an attribute does not already exist, so I'd avoid using it.
IsRecording
IsRecording is a flag on a span that returns true if the end time of the span has not yet been set and false if it has, thus signifying whether the span has ended. In addition it can also be set to false if the application is sampling Open Telemetry spans i.e. you don't want to collect a trace for every single execution of the code but might only want a trace for say 10% of executions to reduce the significant overhead of collecting telemetry.
Tip
The Activity.IsAllDataRequested property in .NET is called IsRecording in the Open Telemetry specification.
using (var activity = activitySource.StartActivity("ActivityName")
{
    await LongRunningOperation().ConfigureAwait(false);
}

public async Task LongRunningOperationAsync()
{
    await Task.Delay(1000).ConfigureAwait(false);

    // It's possible to optionally request more data from a particular span.
    var activity = Activity.Current;
    if (activity != null && activity.IsAllDataRequested)
    {
        activity.SetTag("http.url", "http://www.mywebsite.com");
    }
}
It's worth reading a bit more about Open Telemetry Sampling for more details. In most real world applications, collecting telemetry for every execution of your code is prohibitively expensive and unrealistic, so you will likely be using some form of sampling. Therefore the IsRecording/IsAllDataRequested flag becomes something you should probably always check (as in the above example) before you add events or attributes to your span.
Trace Semantic Conventions
Note the attribute names http.method and http.url I used in the above examples. There are certain commonly used attribute names that have been standardised in the Open Telemetry specification.
Standardised attribute names use a lower_kebab_case syntax with . separator characters. Standardising the names of commonly used attribute names gives applications like Jaeger the ability to show nice UI customisations. Attribute names have been categorised under a few different buckets, it's worth spending some time taking a look at them:
- General: General semantic attributes that may be used in describing different kinds of operations.
- HTTP: Spans for both HTTP client and server.
- Database: Spans for SQL and NoSQL client calls.
- RPC/RMI: Spans for remote procedure calls (e.g., gRPC).
- Messaging: Spans for interaction with messaging systems (queues, publish/subscribe, etc.).
- FaaS: Spans for Function as a Service (e.g., AWS Lambda).
- Exceptions: Attributes for recording exceptions associated with a span.
Exporting Telemetry
There are many plugins for exporting data collected using Open Telemetry which I'll discuss in my next blog post about using Open Telemetry in ASP.NET Core. Therefore, it's highly unlikely that you'd need to manually write your own code to consume data collected using Open Telemetry.
However, if you're interested then Jimmy Bogard has a very well written blog post about using ActivitySource and ActivityListener to listen to any incoming telemetry. In short, you can easily subscribe to consume Open Telemetry data like so:
using var subscriber = DiagnosticListener.AllListeners.Subscribe(
    listener =>
    {
        Console.WriteLine($"Listener name {listener.Name}");

        listener.Subscribe(kvp => Console.WriteLine($"Received event {kvp.Key}:{kvp.Value}"));
    });
Crossing the Process Boundary
Earlier on I spoke about how it's possible to record a trace across process boundaries. For example collecting a trace from a client application through to a database and API both running in separate processes. Given what you now know about recording spans above, how is this possible?
This is where the W3C Trace Context standard comes in. It defines a series of HTTP headers that pass information from one process to another about any trace that is currently being recorded. There are two HTTP headers defined in the specification:
-
traceparent- Contains theversion,trace-id,parent-idandtrace-flagsin an encoded form separated by dashes.version- The version of Open Telemetry being used which is always00at the time of writing.trace-id- The unique identifier of the trace.parent-id- The unique identifier of the span which is acting as the current parent span.trace-flags- A set of flags for the current trace which determines whether the current trace is being sampled and the trace level.
tracestate- Vendor-specific data represented by a set of name/value pairs.
I'm not sure why but the HTTP headers are defined in lower-case. Here is an example of what these headers look like in a HTTP request:
traceparent: 00-0af7651916cd43dd8448eb211c80319c-b7ad6b7169203331-01
tracestate: asp=00f067aa0ba902b7,redis=t61rcWkgMzE
If you're interested in what it looks like to actually implement the W3C Trace Context, Jimmy Bogard has been implementing Open Telemetry for NServiceBus and shows how it can be done.
Baggage
Similar to attributes, baggage is another way we can add data as name value pairs to a trace. The difference is that baggage travels across process boundaries using a baggage HTTP header as defined in the W3C Baggage specification. It is also added to all spans in a trace.
baggage: userId=alice,serverNode=DF:28,isProduction=falseSimilar to the way attributes can be recorded using the AddTag and SetTag methods, with baggage we can use the AddBaggage method. For some reason a SetBaggage method that would also update baggage does not exist.
using (var activity = activitySource.StartActivity("ActivityName")
{
    await LongRunningOperation().ConfigureAwait(false);
}

public async Task LongRunningOperationAsync()
{
    await Task.Delay(1000).ConfigureAwait(false);

    // Log an attribute containing arbitrary data.
    Activity.Current?.AddBaggage("http.method", "GET");
}
So why would you use baggage over attributes? Well, if you have a global unique identifier for a particular trace like a user ID, order ID or some session ID it might be useful to add it as baggage because it's relevant to all spans in your trace. However, you must be careful not to add too much baggage because it will add overhead when making HTTP requests.
You're Already Using It
The .NET team in their wisdom decided to take quite a large gamble on Open Telemetry. They not only repurposed their Activity type to represent a span but they also instrumented several libraries, so you don't have to.
The HttpClient already adds the W3C Trace Context HTTP headers from the current span automatically if a trace is being recorded. Also an ASP.NET Core application already reads W3C Trace Context HTTP headers from incoming requests and populates the current span with that information.
Since the .NET team has made it so easy to collect telemetry and integrated the Activity type into the base class libraries, I expect a lot of other libraries and applications to follow this example.
The ILogger interface from the Microsoft.Extensions.Logging NuGet package used commonly in an ASP.NET Core application is also able to collect logs compatible with Open Telemetry too.
Up Next
I've discussed that Open Telemetry is all about collecting Logs, Metrics and Trace data and gone fairly deep into collecting Trace data. In my next post, I'll cover how you can configure ASP.NET Core and Open Telemetry traces and logs.
Comment
Initializing...